Case study: Gumlet turned ChatGPT mentions into 20% of inbound revenue. Read it →

Generative Engine Optimization Statistics 2026

Executive summary
Software buying is moving out of the classic search results page and into AI answer surfaces. For years, a B2B buyer typed a “best X software” query into Google, opened a stack of listicles and vendor pages, and assembled a shortlist by hand. Now Google’s AI Overview often answers first: it names products, cites sources, and frames the category before the buyer ever scrolls to a blue link.
That shift rewrites how B2B software brands get found. Visibility no longer means only ranking in the top 10. It means earning mentions and citations inside the answer itself, the core of Generative Engine Optimization (GEO). The brands that appear in AI Overviews on commercial software queries are the ones buyers see when they are still forming a shortlist.
We built this report from DerivateX’s June 2026 panel of 100 commercial B2B software queries across 20 categories. The panel captured 1,259 Google AI Overview citations, the organic results for the same queries, and the product names each Overview recommended. The data shows a clear pattern: AI Overviews and classic Google results are different surfaces, third-party listicles still dominate the citation mix, and first-party ownership of the recommendation is rare.
Throughout this report, we explore how often AI Overviews cite a recommended product’s own site, how far those citations sit from the organic list, which page types win the citation share, and where category baselines diverge. For B2B SaaS teams, the practical move is to treat AI Overview citation as its own KPI, not a side effect of ranking. See also DerivateX’s 8 GEO metrics for CMOs.
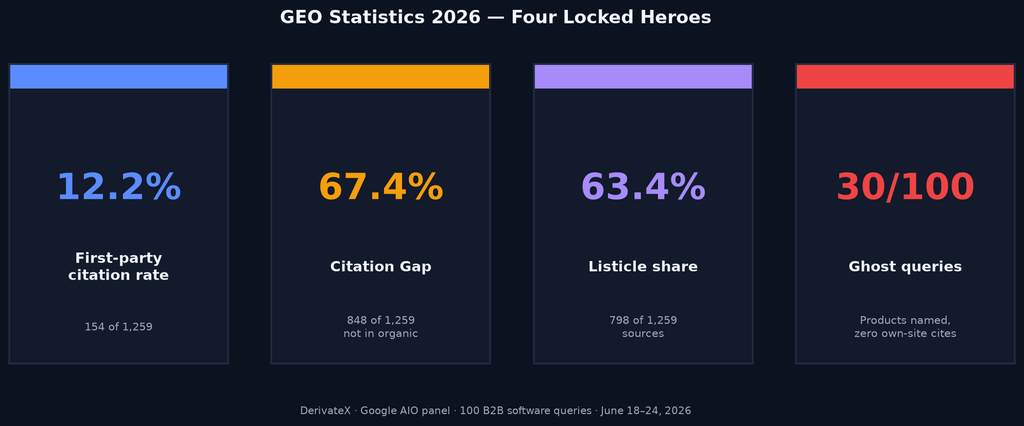
Four locked heroes (June 18–24, 2026 Google AIO panel)
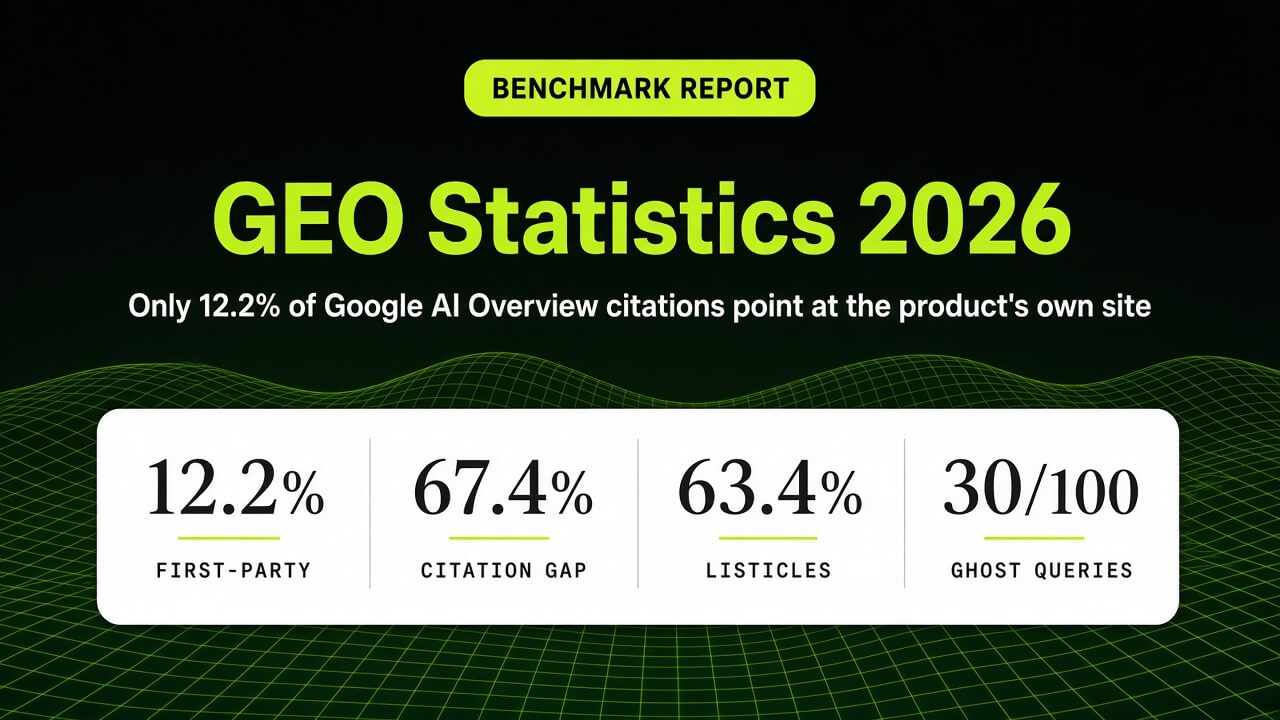
- 12.2% first-party citation rate (154 of 1,259)
- 67.4% Citation Gap, sources not also in organic (848 of 1,259)
- 63.4% listicle / “best X” share (798 of 1,259)
- 30 of 100 ghost queries, products recommended, zero own-site cites
First-party citation is still the exception
Only 12.2% of AI Overview citations in this panel pointed at a recommended product’s own site (154 of 1,259). A broader “any vendor site” label reached 16.8% (211 of 1,259). On commercial “best software” queries, most of the citation surface still belongs to someone else.
Only 12.2% of AI Overview citations pointed at a recommended product’s own site.
AI Overviews and Google results are not the same map
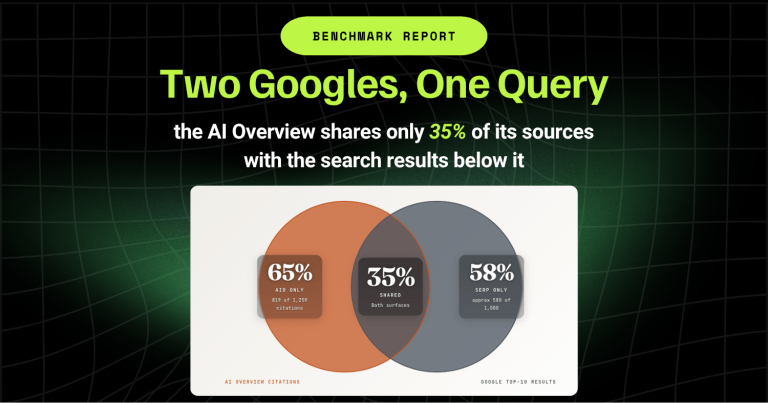
67.4% of AI Overview citations in this panel did not also appear as a normal Google result for the same query (848 of 1,259). DerivateX’s published Two Googles benchmark on the same study design reports 65% AI Overview–exclusive sources and 35% top-10 overlap. Ranking helps when sources do overlap, but it does not explain Overview selection by itself.
67.4% of AI Overview citations never appear in the organic list for the same query.
Listicles still buy most of the citation surface
Third-party “best X” blogs supplied 63.4% of citations (798 of 1,259). Vendor sites were 16.8%, YouTube / video 9.0%, review sites 5.0%, and Reddit / forums 4.7%. Teams that ignore comparison inventory leave most of the Overview’s source layer to competitors and publishers, which is why third-party assets for AI search matter as much as owned pages.
Third-party “best X” blogs still buy 63.4% of the citation surface.
Recommendation without ownership is common
On 30 of 100 queries (30%), the AI Overview recommended products while citing zero recommended-product own-site URLs. Buyers can see a brand name and never touch a first-party page inside the Overview’s source list. That split is the practical reason to track recommendation share vs citation share as separate lines.
On 30 of 100 queries, products were recommended with zero first-party own-site citations.
Category baselines matter more than the global average
Own-site share and citation gap swing hard by category. Tech pack software averaged about 44.6% own-site share in this sample; video hosting averaged about 1.4%. Project management and help desk sat near 80% average citation gap. Strategy that starts from the 12.2% global figure alone will mis-set expectations.
Category baselines swing hard, tech pack ~44.6% own-site vs video hosting ~1.4%.
Key takeaways
- First-party citation is rare on commercial software queries. Only 12.2% of AI Overview citations in this panel were the recommended product’s own site (154 of 1,259).
- AI Overviews and classic Google results are different surfaces. 67.4% of AI Overview citations never appear in the organic list for the same query (848 of 1,259).
- List pages still dominate the citation mix. Nearly two thirds of sources were third-party “best X” style pages (63.4%, 798 of 1,259).
- Video is an AI Overview surface, not a Google-results twin. YouTube / video is 9.0% of citations (113 of 1,259); youtube.com alone is 8.3% (105 of 1,259). 81.4% of YouTube / video citations were Overview-exclusive.
- Recommendation without ownership is common. Nearly one in three queries (30 of 100) named products while citing no recommended-product own-site URL.
- Shared sources still skew high in the SERP. Among 411 overlapping citations, the median Google rank was 4, and 45.7% sat in positions 1–3.
- Source concentration is moderate, not monopolized. 720 distinct domains appeared across 1,259 citations. The top 10 domains accounted for 20.7% (260 of 1,259).
- Treat GEO metrics separately from SEO rankings. Measure citation rate, first-party share, source mix, and SERP overlap as distinct KPIs, the same discipline behind DerivateX’s AI Visibility Score.
- Category baselines differ sharply. Use local category figures, not only the 12.2% global average.
- Product-level ghost matching is directional only. About 73.9% of product mentions lacked a matching own-domain citation on the same query; keep the 30% query-level figure as the cleaner headline.
- Overlap by source type is uneven. Reddit / forums overlapped on 93.2% of citations; YouTube / video overlapped on only 18.6%.
- Four hero metrics remain gated for a multi-engine v2: AI visibility / mention rate, preferred-source rate, cross-engine agreement, and 30 / 60 / 90-day visibility lifts.
What generative engine optimization means for B2B software
Generative Engine Optimization (GEO) is the work of making a brand nameable and citable inside AI-generated answers. Classic SEO optimizes for blue-link rankings. GEO optimizes for whether an AI system mentions the brand, cites a URL, and, in a fuller multi-engine hub, treats a page as a preferred source for a fact. Adjacent answer-surface work lives under AEO; DerivateX’s method for building corroborating evidence is Citation Engineering.
GEO is not ranking for blue links, it is earning the mention and the citation inside the answer.
For B2B SaaS, the highest-leverage GEO questions are commercial: “best (category) software,” “best (category) for (segment),” and dated “top (category) tools 2026” queries. Those are the prompts this panel measured. They sit at the moment when buyers are assembling a shortlist, not when they already know the vendor they want.
This report is DerivateX’s Google AI Overview citation statistics hub for September 2026. Every primary percentage below comes from the June 2026 panel unless a line is labeled as a prior published DerivateX study. It is shippable as an AIO citation report today. It is not yet a finished multi-engine GEO encyclopedia, and the methodology section is explicit about what is still gated for v2.
How often AI Overviews cite a brand’s own site
Only 12.2% of AI Overview citations in DerivateX’s June 2026 panel pointed at a recommended product’s own website (154 of 1,259 citations across 100 queries and 20 software categories, logged out, June 18–24, 2026).
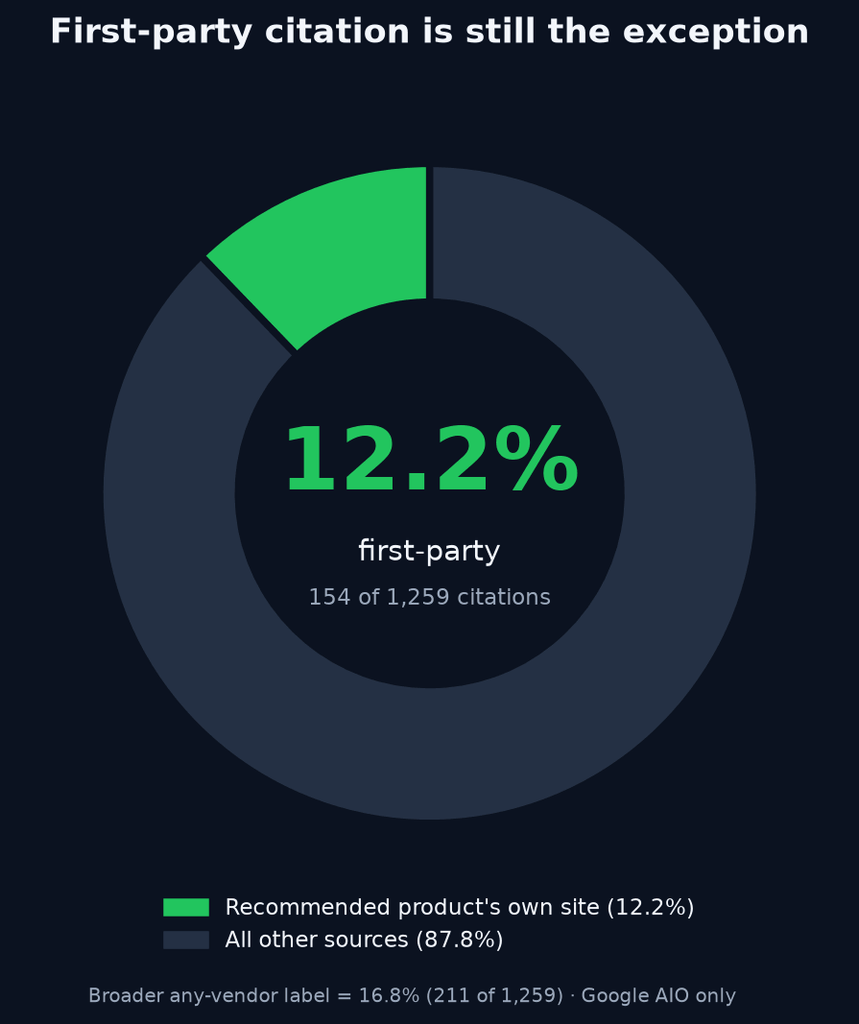
Hero stat: 12.2% first-party (recommended product’s own site) · 154 of 1,259
Broader any-vendor label: 16.8% (211 of 1,259)
A broader “vendor site of any kind” label in the same file covers 16.8% of citations (211 of 1,259). The tighter 12.2% figure matches the “recommended product’s own site” column and is the safer quote for first-party citation rate. For the owned-vs-influenced framing teams should report, see first-party vs third-party citations in LLMs.
That gap between being named and being cited as a first-party source is the core GEO problem for vendors. An Overview can put a product in the answer text while pointing readers at listicles, video, or review aggregators for the evidence. Brands that only watch organic rank miss whether they own any of the citation layer behind the recommendation.
Being named is not the same as owning the citation layer behind the recommendation.
Category variation is large enough that the global average should never be the only planning number. Using average per-query own-site share, tech pack software averaged about 44.6% in this sample, while video hosting averaged about 1.4%. Using pooled citations, tech pack software was 42.6% own-site (26 of 61) and video hosting was 2.2% (2 of 90).
Scope and limit: this is Google AI Overview only, on commercial software queries. It is not a ChatGPT, Perplexity, or Gemini first-party rate.
Where AI Overview sources diverge from Google results
In a direct recompute of the panel raw file, 32.6% of AI Overview citations also appeared as a normal Google result for the same query (411 of 1,259), and 67.4% did not (848 of 1,259).
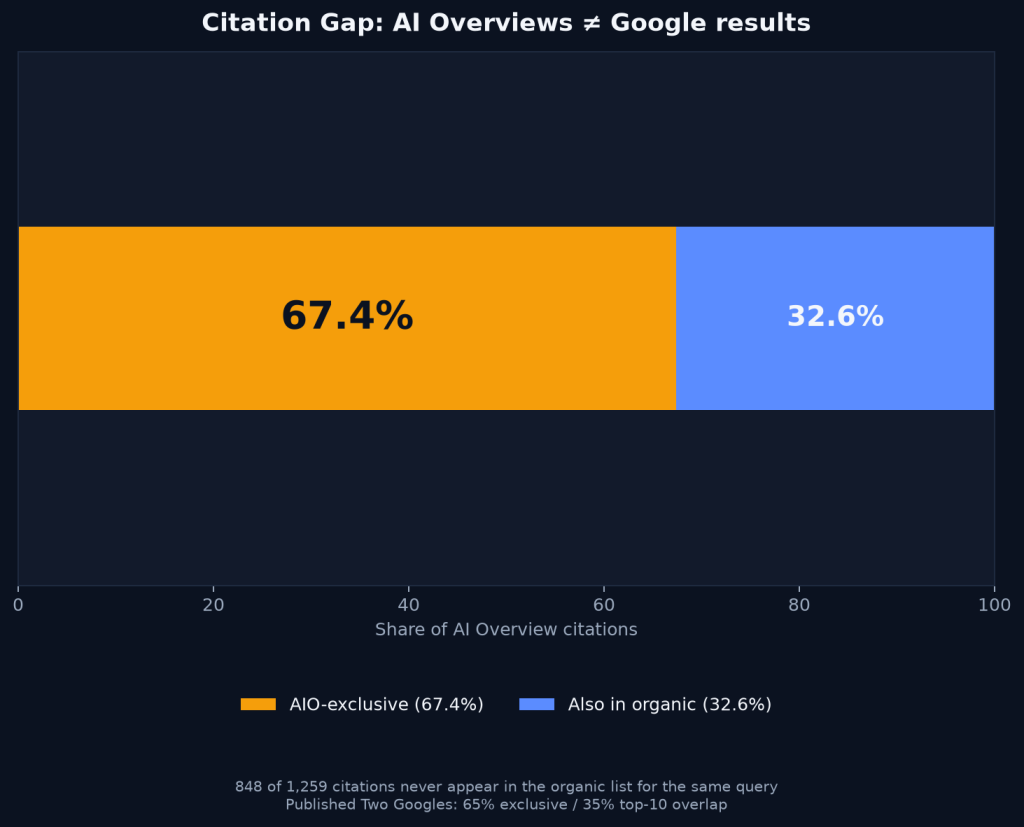
Citation Gap: 67.4% of AIO citations are exclusive to the Overview (848 of 1,259).
Published Two Googles: 65% exclusive / 35% top-10 overlap.
DerivateX’s published Two Googles benchmark, built on the same study design, reports 35% top-10 overlap and 65% AI Overview–exclusive sources across 1,259 citations. Use the published Two Googles page when you need the public cite.
Among the 411 overlapping sources in the raw file, the median Google rank was 4. 45.7% were in positions 1–3, and 99.5% were somewhere in the captured organic list labeled as a Google result. Shared sources still skew toward strong ranks, but most Overview citations still sit outside that list.
Overlap is not uniform by source type:
- Reddit / forums overlapped with classic Google on 93.2% of citations (55 of 59)
- Vendor own sites overlapped on 52.6% (111 of 211)
- Review sites overlapped on 50.8% (32 of 63)
- Third-party “best X” blogs overlapped on only 23.6% (188 of 798)
- YouTube / video overlapped on 18.6% (21 of 113)
Decision kernel: treat AI Overview citation and Google ranking as separate KPIs. Ranking in the top 5 improves the odds of a shared source, but it does not predict AI Overview selection by itself. Do not use this panel to claim that improving organic rank causes AI Overview citation. For ongoing LLM visibility tracking across engines, keep the AIO Citation Gap as its own line.
Ranking helps when sources overlap, it does not explain Overview selection by itself.
What page types earn AI Overview citations
Source-type mix across all 1,259 AI Overview citations in this panel:
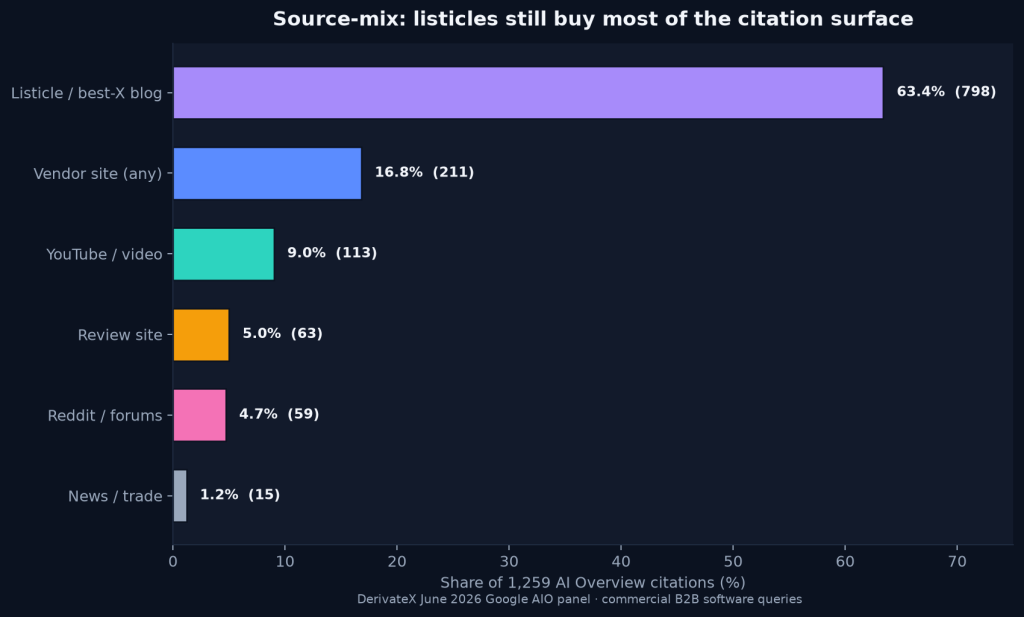
| Source type | Citations | Share |
|---|---|---|
| Third-party “best X” blog | 798 | 63.4% |
| Vendor’s own site (any vendor page in file taxonomy) | 211 | 16.8% |
| YouTube / video | 113 | 9.0% |
| Review site (G2 / Gartner class) | 63 | 5.0% |
| Reddit / forums | 59 | 4.7% |
| News / trade press | 15 | 1.2% |
Listicle Layer: Third-party “best X” blogs = 63.4% of all citations (798 of 1,259).
youtube.com alone accounts for 105 citations (8.3%). reddit.com accounts for 56 (4.4%). Together, those two community domains are 12.8% of all citations (161 of 1,259). The gap between YouTube / video at 9.0% and youtube.com at 8.3% is eight non-YouTube video-class rows in the taxonomy, so both figures are correct for different questions.
The practical read is straightforward. Listicle and comparison inventory still buys most of the AI Overview citation surface on these queries. Vendor sites without third-party coverage are underweighted relative to how often products are named. Video is a real Overview channel with low SERP twinship: 81.4% of YouTube / video citations were AI Overview–exclusive (92 of 113), while 93.2% of Reddit / forum citations also appeared in classic Google results.
81.4% of YouTube / video citations were AI Overview–exclusive, video is an Overview surface, not a SERP twin.
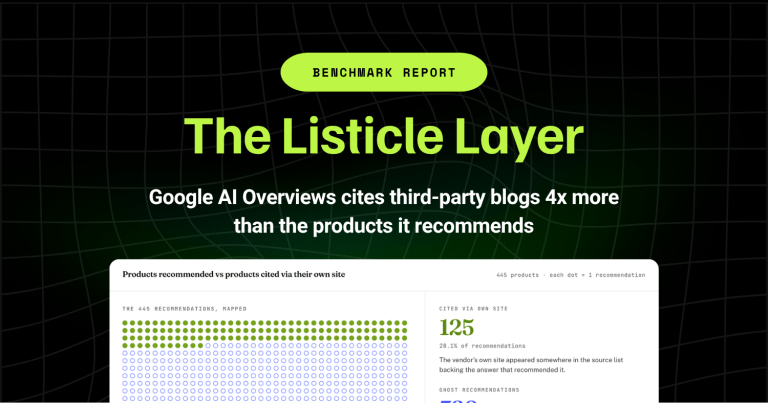
For deeper recommendation-versus-citation analysis inside a single Overview, use the Listicle Layer benchmark rather than rewriting it here. To inventory which domains engines actually cite in a category, use DerivateX’s Citation Surface Map.
How often products are recommended without a first-party cite
On 30 of 100 queries (30%), the AI Overview recommended one or more products while citing zero URLs marked as a recommended product’s own site.
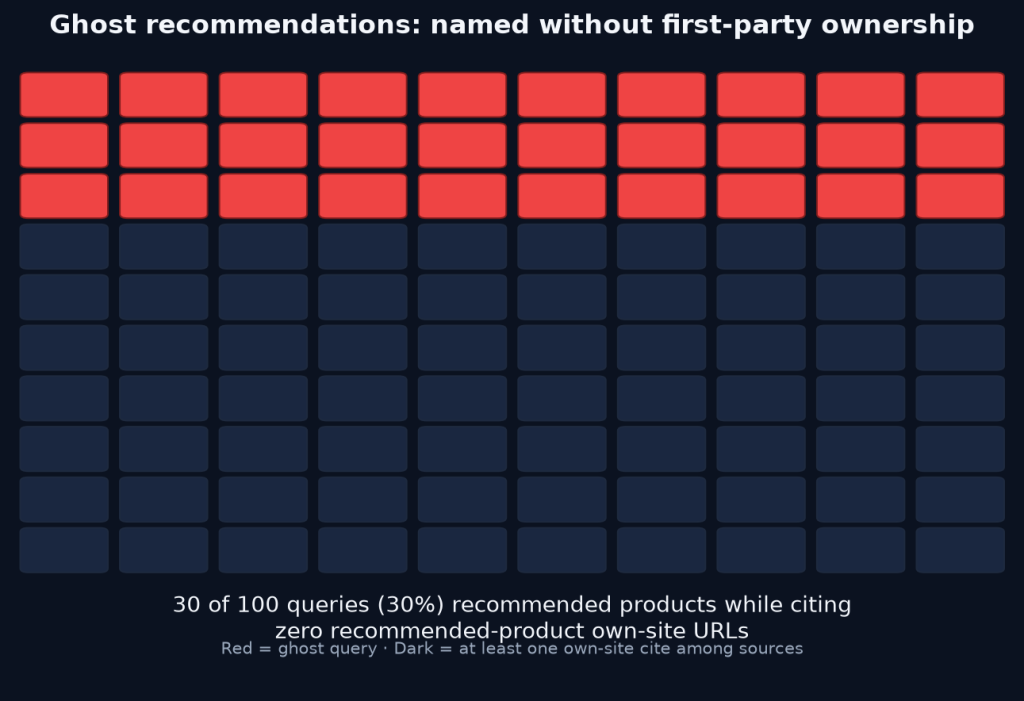
Ghost queries: 30 of 100 (30%), products recommended, zero recommended-product own-site citations.
At the product-mention level, 445 product recommendations appear in the answer tab. Using a conservative domain-token match against own-site citations on the same query, about 26.1% of product mentions had a matching own-domain citation on that query, and about 73.9% did not. Treat the 30% query-level figure as the cleaner headline. Treat the product-level match as directional because product-to-domain mapping is imperfect.
That “ghost recommendation” pattern is why GEO cannot stop at brand mention. A buyer can leave the Overview with a shortlist and never see a first-party URL among the cited sources. Brands that only celebrate being named are measuring half the problem.
A buyer can leave with a shortlist and never see a first-party URL among the cited sources.
Disqualifier: this ghost rate is for Google AI Overview commercial software queries in this panel. It does not measure whether the brand’s site ranks organically, and it does not measure ChatGPT or Perplexity recommendations.
How dense a typical AI Overview answer is
📈 Density snapshot: avg 4.45 products · 12.59 sources per query · median 4 / 12
Across 100 answers, Google recommended 4.45 products per query on average and cited 12.59 sources per query on average. The median answer named 4 products and cited 12 sources. Source counts per query ranged from 3 to 46. 49 of 100 answers ended by asking the user a follow-up question.
202 distinct product names appeared at least once. The most frequent names in this panel were HubSpot (10), QuickBooks (9), and Jira Service Management (6).
Density matters for strategy. An Overview that names four products and cites a dozen sources is not a single-winner slot. Brands compete for mention and for citation share inside a crowded answer, not for a lone featured snippet.
Brands compete for mention and citation share inside a crowded answer, not for a lone featured snippet.
Which domains concentrate AI Overview citations
720 distinct domains · top 10 = 20.7% of citations, concentrated, not monopolized.
720 distinct domains appear across 1,259 citations. The top 10 domains account for 20.7% of citations (260 of 1,259). Highest-frequency domains in this panel include youtube.com (105), reddit.com (56), gartner.com (21), zapier.com (15), and g2.com (13). Other frequent domains include swarmify.com (12), onbrandplm.com (11), forbes.com (9), zoho.com (9), and verito.com (9).
Concentration is real but not a monopoly. Hundreds of domains still participate. Domain frequency is also not the same as preferred-source status. A domain can be cited often because it publishes many listicles, not because Google treats it as the fact owner for every claim. Preferred-source coding remains a v2 hero metric.
Where categories diverge on citation gap and own-site share
Local baselines beat the global average, own-site share runs from ~1.4% (video hosting) to ~44.6% (tech pack).
Each category has five queries in this panel. Average per-query citation gap (share of sources not also in Google results) and average per-query own-site share:
| Category | Avg citation gap | Avg own-site share |
|---|---|---|
| Project management | 79.6% | 4.0% |
| Help desk | 79.4% | 13.0% |
| Accounting | 75.7% | 5.0% |
| Contract management | 73.0% | 11.0% |
| Video hosting | 70.5% | 1.4% |
| Social media mgmt | 68.8% | 19.1% |
| CRM | 68.6% | 7.0% |
| ITSM | 67.8% | 5.9% |
| Marketing automation | 67.1% | 2.6% |
| Business intelligence | 63.9% | 8.1% |
| Spend management | 63.6% | 28.6% |
| App monitoring | 63.4% | 5.7% |
| HR | 62.1% | 4.2% |
| iPaaS / workflow | 59.0% | 5.4% |
| Cybersecurity | 58.6% | 15.7% |
| Sales engagement | 57.5% | 9.3% |
| AI time tracking | 49.3% | 42.0% |
| Tech pack software | 45.2% | 44.6% |
| Compliance automation | 44.1% | 25.0% |
| QuickBooks hosting | 32.9% | 39.9% |
Category decision kernels:
- QuickBooks hosting is the closest category to classic Google in this sample (32.9% average citation gap). Most other categories show large AI Overview–exclusive citation shares.
- Project management and help desk sit at the high-gap end (79.6% and 79.4%), so organic rank alone is a weak proxy for Overview inclusion there.
- Third-party “best X” share is highest in iPaaS / workflow (77.8%), business intelligence (75.8%), and app monitoring (74.4%). It is lowest in accounting (44.1%), tech pack software (47.5%), and CRM (48.4%).
- Own-site share is highest in tech pack software, QuickBooks hosting, and AI time tracking, and lowest in video hosting, marketing automation, and accounting.
Category strategy should start from these local baselines, not from the 12.2% global average alone.
How B2B SaaS teams can maximize visibility in AI search
Winning in AI search on commercial software queries means being visible and useful inside the answer, not only underneath it. The brands that earn recommendations early in the shortlist window are the ones buyers notice first. The brands that also earn first-party citations keep a path back to their own site when the Overview’s sources are followed.
The tactics that worked for classic SEO do not carry over neatly. Answer surfaces pull from content that is clear, comparable, and easy to cite. On this panel, that still means listicle and comparison inventory for citation volume, first-party product and documentation pages for ownership of the recommendation, and video where the goal is Overview presence that classic results do not twin.
Practical moves from this data:
Five practical moves
- Choose listicle and comparison coverage when the goal is AI Overview citation volume on “best software” queries, that format is 63.4% of this panel’s citations.
- Choose first-party site improvements when the goal is ownership of the recommendation, own-site citations are only 12.2% today.
- Choose video when the gap versus classic Google is the problem, 81.4% of YouTube / video citations in this panel never appear in the organic list for the same query.
- Do not treat a #1 Google ranking as proof of AI Overview inclusion. Measure citation and ranking as separate KPIs.
- Report every DerivateX primary percentage with date window, engine, n=, and ICP scope.
Companion public frameworks for the next layer of analysis: Two Googles for SERP overlap, Listicle Layer for recommendation versus citation inside an Overview, Agreement Gap for dual-engine brand and source agreement, and Authority Inversion for where ChatGPT gets software recommendations. Broader panel context: B2B SaaS AI Citation Study.
Definitions used in this report
- Mention / recommendation: the product is named in the AI Overview answer text.
- Citation: a URL listed as a source for that AI Overview.
- First-party citation: a citation marked in the raw file as a recommended product’s own site.
- Citation Gap: share of AI Overview citations that are not also a normal Google result for the same query.
- Source mix: distribution of citations by page type in the raw-file taxonomy.
- Ghost recommendation (query-level): products are recommended on a query that has zero recommended-product own-site citations.
Visibility, preferred-source rate, cross-engine agreement, and 30 / 60 / 90-day lifts are defined in DerivateX methodology notes and need Peec or multi-engine panels. They are not computed from this file alone.
Methodology
To create this report, we relied on DerivateX’s primary Google AI Overview citation panel for commercial B2B software queries.
- Design: 100 commercial Google searches of the form “best (category) software” and close variants across 20 software categories. Captured June 18–24, 2026 while logged out.
- Captured per query: organic Google results, every AI Overview source URL, source-type labels, whether the source also appeared in Google results, Google rank when present, the full AI Overview answer text, and the product names recommended.
- Counts used here: 100 answers, 1,259 AI Overview source rows, 817 organic-result rows, 445 product recommendations, 720 distinct domains, 202 distinct product names.